KEYWORDS: How to Use Mini Infographics to Improve On-Page SEO How do you optimize infographics for SEO? Why infographics are the secret to super SEO How to Boost Your SEO With Infographics
The Secret Mini Infographics to Improve On-Page SEO?
SEO
|
August 19, 2022
Do you remember the era of SEOs convincing to write 5000 words of content for increasing organic traffic to the desired website? Earlier then, people used to spend a long span of time putting the finest and most informative articles and answering every single question available on the internet.
You must have noticed the bounce rate on a piece of content was higher than 80%, you know why? Because people stop scrolling immediately after seeing such a huge chunk of information.
In reality, viewers or audiences run away from the website instantly if they do not find the information they need in seconds. Viewers lack patience and have no time to spare, so the chance of your content being read is very low. The audience needs two simple things: to skim content and to get an answer instantly.
Before you bounce from this article because I did not answer your question, well the answer is: yes.
So, to reduce your bounce rate, you can write a few words, compact and on-point information that the audience needs.
How?
You can easily achieve this content by creating unique mini infographics. It is a real game-changer! Such content idea is appealing to all impatient viewers/readers.
Wait, Wait, Wait. Before you bounce from this article let me tell you quickly about the detailed steps to take for using infographics to achieve your SEO goal .
I’ll show you easy steps to edit infographic templates that you can customize from various free web tools or apps such as Venngage’s Infographic Maker.
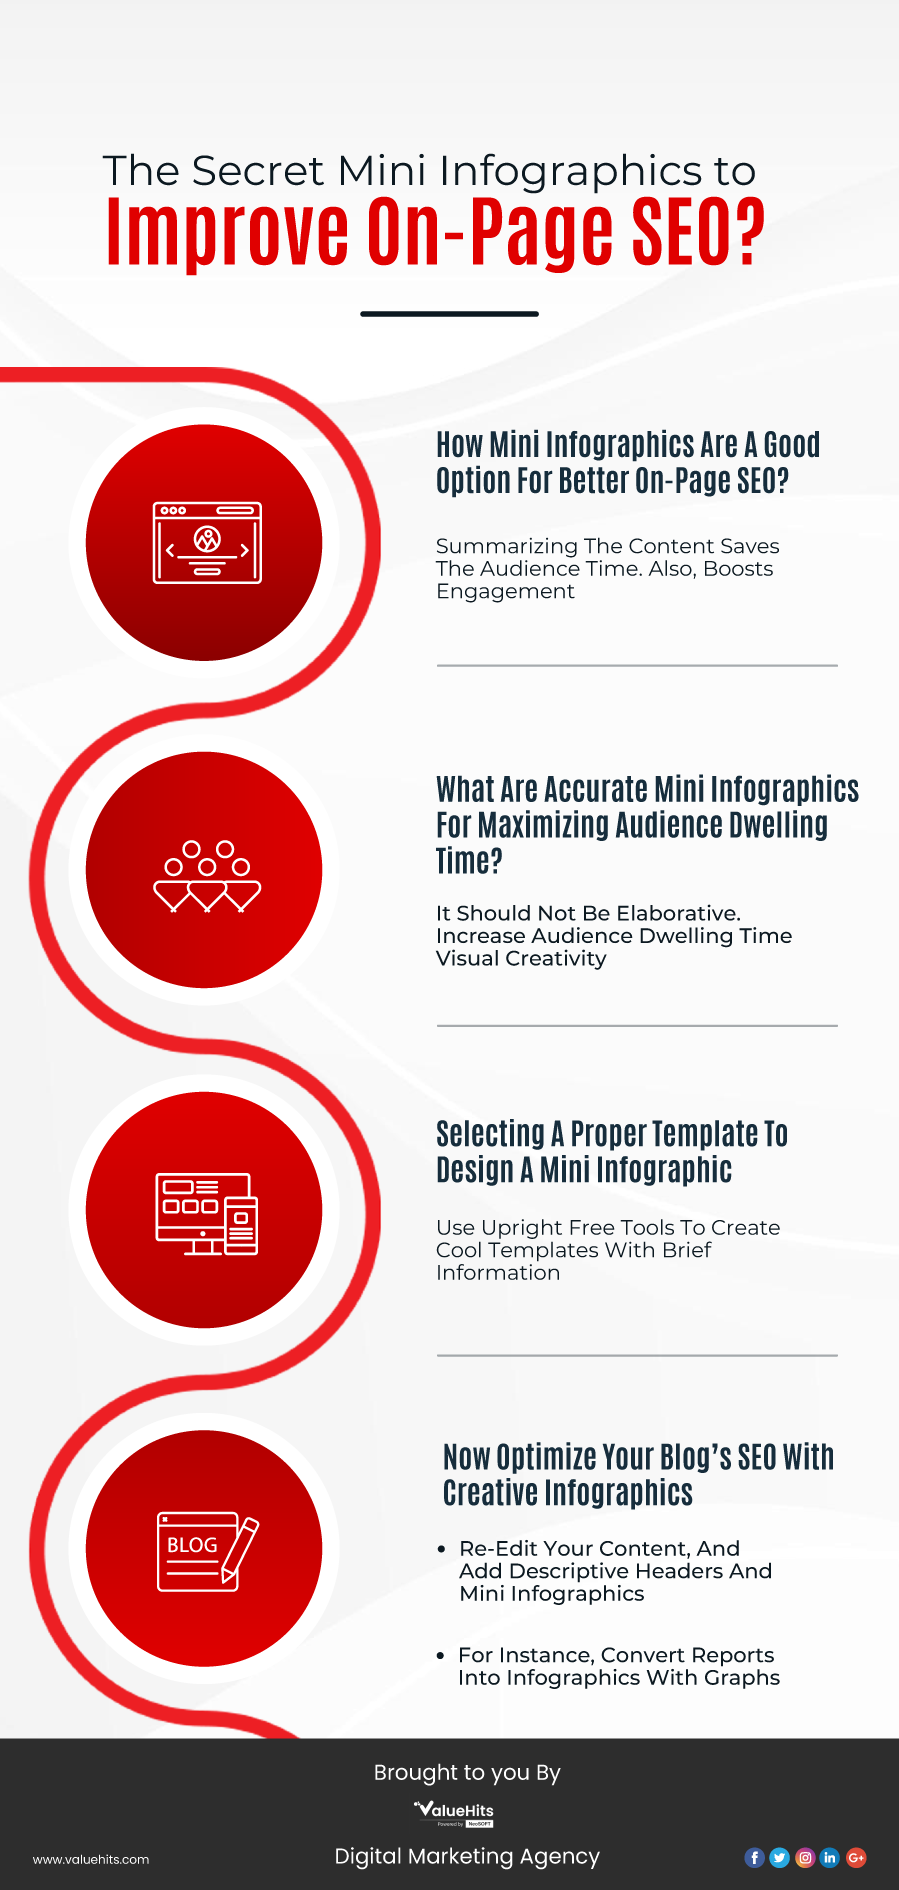
Part 1: How mini infographics are a good option for better on-page SEO?
A few years earlier, we decided to observe how our customers interact with the content we are providing on the website. For this experiment, we showed articles to the audience and scrolled through them rapidly.
We got to know the audience decide within the first 10 seconds to read your content or not.
Indirectly, the audience does these two things:
> The chances of the audience spending more time is when blog pages are broken into readable multi-header content, readers must get a clear indication of what is coming next for them.
> The audience was more likely to choose content that had a break in the text and a mini infographic or any other visual content, approximately after every 100 words.
However, there is not something new to know. Even Google has started to directly come to the point and shows nice pictures to people.
Viewers can see image breaks or little interactive question-and-answers boxes in the search engine results. Therefore, now we understand that audience needs numerous breaks in the content because viewers are a bit lazy to read.
You will start to observe this more commonly around several top websites and their pages. Mostly, in content that has some word examples or certain variations of that word in it. You can go to Google and check it by yourself.
One more thing you will notice when you Google such content by yourself, is the top-ranked posts have constructed subheadings that are simplified for the readers. For instance:
The optimized headings also have a relevant image or mini infographic, which easily represents the written data. This will keep the audience engaged.
Part 2: What are accurate mini infographics for maximizing audience dwelling time?
When it is about designing your mini infographics, you must understand it has to be mini by default.
You must remember that the infographic here is going here to summarize your written content.
Try to remember these:
> Always use a pecking order for breaking up the long parts of the texts you have written. In such a way, the audience will get to know the important pointers, which will engage them in your content.
> Keep the pointers simple, an attractive visual takeaway.
With higher engagement and lower bounce rates, there is going to be higher information retention. Also, infographics are one of the best visual cues that is available as it reinforces learning.
Part 3: Selecting a proper template to design a mini infographic
Do not freak out because you do not know anything about designing, or if you are unsure how you can start with the designing. We are not asking you to become a pro at it.
With a few good tools, you can create extremely attractive mini infographics. We have taken the responsibility today for outlining certain examples of some mini infographic templates, which you can use directly as well. .
You do not need to be a pro designer for creating Infographics. You can always get easy-to-edit templates and began creating your mini infographic..
Part 4: Now optimize your blog’s SEO with creative infographics
So, now you have understood what matters for improving on-page SEO and how significant it is to reformat your content for better information consumption, you must visit Google Analytics, and take a look at the pages that have high bounce rates, which are ranking on the latter last pages of Google.
Start by studying what the current rankings are and what are their bounce rates.
Once you have recorded the basics or studied them, began testing these methods by re-editing your content. Remove the heavy text content, add descriptive headers, and summarize mini infographics.
For instance, you can create statistics in a visual format and summarize boring reports or large numbers by using the mini infographic:
After each 100 to 150 words in your content, break the content into a mini infographic and see the changes in your results within a few weeks.
You can notice the best results all yourself!
We are not alone in claiming how a mini infographic can change your SEO game. You can surely check the insights by yourself.
The essential part is that it is important to try this method by yourself to check whether it works or not. Every SEO Agency in Mumbai has to come across different websites, but I hope these guidelines will help you improve your rankings by adding mini infographics.
So, test these quick tips out and see if it works and helps your work. If you could influence your SEO rankings, you can save a lot of time.
Integration of Canva and LinkedIn for better ads experience
July 24, 2026
Making impressive and captivating ads on LinkedIn may require a combination of many skills, such
The Cost of SEO in the UK: What Should You Expect to Pay in 2026?
July 21, 2026
If you run a business in the UK, you have likely asked one question: how much does SEO cost?
Decoding Google Analytics 4 (GA4): The Retail KPI Playbook Most Brands Are Getting Wrong
July 16, 2026
Running a busy online shop is a lot like managing a physical store on a crowded street.

Hardik Mody
Senior Manager - Digital Marketing atValueHits
Hardik Mody is a Senior Manager in Digital Marketing. He plans and coordinates the marketing activities of ValueHits, a full-service Digital Marketing Agency in Mumbai, India. With his experience and Expert knowledge in the field, he identifies potential customers and develops marketing campaigns. Also, he is efficient enough to meet the client’s requirements and well-organized in handling multiple tasks.